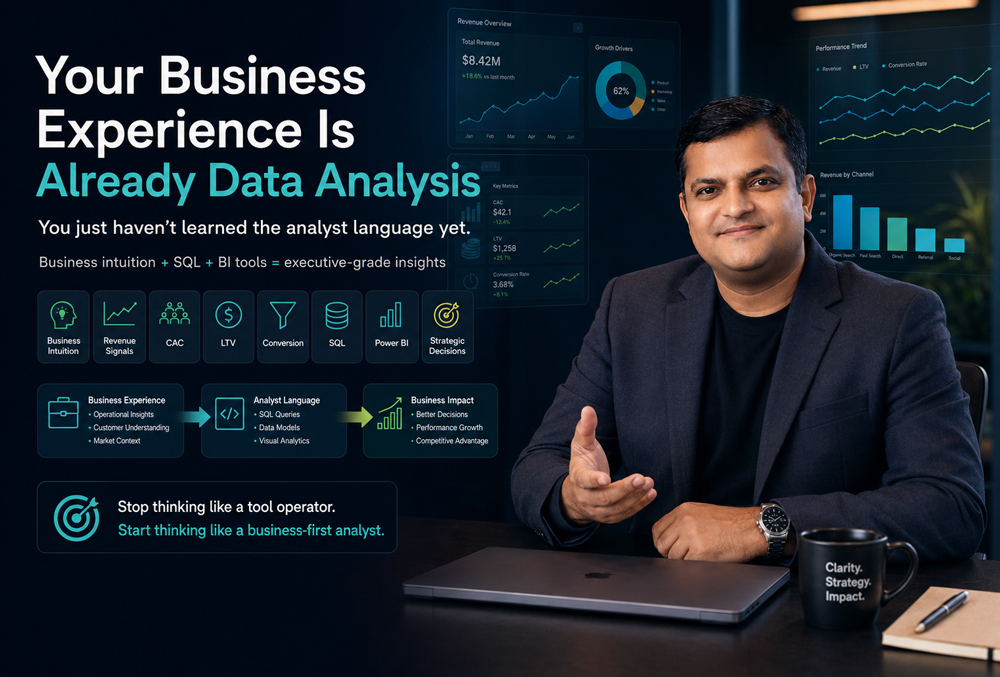
If you have managed sales targets, monitored marketing budgets, or handled customer service escalations, you already possess the most difficult skill in data analytics: business intuition. The transition to high-value data analysis is not about learning how to think from scratch; it is about learning the technical syntax to quantify the business friction you already understand. A pure tool operator reports the numbers; a business-first analyst uses their past operational experience to spot revenue leaks, interpret customer acquisition cost context, and drive strategic executive decisions.
The Myth of Starting From Scratch
If you have worked with sales quotas, conversion follow-ups, service delays, or customer retention programs, you are not starting from zero. You already understand business signals. You know what it feels like when a product is priced wrong, when a marketing campaign attracts the wrong audience, or when a bottleneck in operations costs the company money.
The analytics industry has sold a lie: that to be a data analyst, your primary identity must be a coder. Bootcamps glorify Python scripts and complex SQL joins, convincing professionals with years of operational experience that they are “beginners.”
This is fundamentally backwards.
Syntax can be taught in weeks. Business maturity takes years to develop. If you know how a business generates revenue, acquires customers, and controls costs, you already have the foundation of an elite analyst. Your next step is not to become a software engineer-it is to learn the analyst language so you can translate those business signals into quantitative insights that companies can act on.
The Difference Between Tool Operators and Business Analysts
Many early-stage analysts with six months to three years of experience hit a wall. They know Tableau. They know Power BI. They can write a SQL query to extract a dataset. Yet, they feel like they are just fulfilling reporting tickets instead of doing real analysis.
This happens because they focus on the tool rather than the business mechanism.
How a Tool Operator thinks:
- “How do I format this date column in SQL?”
- “What chart type looks best for this dashboard?”
- “The stakeholder asked for sales by region, so I will pull sales by region.”
How a Business-First Analyst thinks:
- “Why is the stakeholder asking for sales by region? What decision is pending?”
- “If the Northeast region is down 15%, is it a volume problem (fewer leads) or a conversion problem (lower close rate)?”
- “How does this metric impact our gross margin?”
Your past business experience is the exact mechanism that allows you to ask the second set of questions. You just need the framework to translate your operational intuition into data strategy.
Translating Your Experience into the Analyst Language
To move from an operational role (or a basic reporting role) into a strategic analytics position, you must map your practical experience to formal business metrics.
Here is how real-world business experience translates into executive-grade data analytics:
| Your Business Experience (The Reality) | The Analyst Language (The Concept) | The Core Metrics to Master |
| “Marketing is sending us terrible leads that never buy.” | Lead Quality & Conversion Analytics | Lead-to-Close Rate, Sales Velocity, Pipeline Conversion |
| “Customers buy once when we run a discount, but they never come back.” | Cohort Retention Analysis | Repeat Purchase Rate, Churn Rate, LTV (Lifetime Value) |
| “We are spending way too much to get a single customer.” | Marketing Efficiency Analytics | CAC (Customer Acquisition Cost), ROAS (Return on Ad Spend) |
| “Our reps spend too much time on accounts that don’t pay us enough.” | Customer Segmentation & Profitability | ARPA (Average Revenue Per Account), Cost to Serve, Tiered Margin Analysis |
The “CAC is Not Enough” Trap: A Translation Example
Let’s look at a specific example of how your business intuition is far superior to raw technical skill.
Imagine you are evaluating a recent marketing campaign. A junior analyst who only knows tools pulls the data, calculates the Customer Acquisition Cost (CAC), and reports to the executive team: “Good news. Our CAC dropped from $150 to $80. The campaign is a success.”
But if you have a background in sales, marketing, or operations, your internal alarm bells are ringing. You intuitively know that CAC is not enough to judge a campaign. You have felt the pain of dealing with low-quality customers who demand massive support, return products, or cancel subscriptions after one month.
Because of your business background, you understand customer acquisition cost context. You don’t just report the $80 CAC; you run a deeper acquisition metrics analysis.
You use your data skills to ask the right questions:
- What is the CAC vs CLV? It doesn’t matter if we acquired them for $80 if their Customer Lifetime Value (CLV) is only $90. We are operating on razor-thin margins.
- What is the payback period? If it takes 12 months to earn back that $80, but the average customer churns in 6 months, we are actively losing money on this “successful” campaign.
- Are these sustainable growth metrics? Did we lower CAC by offering a massive 50% discount? If so, we haven’t improved marketing efficiency; we’ve just eroded our gross margin to buy revenue.
This is marketing efficiency analytics in action. The SQL query to pull the data is exactly the same for both analysts. The difference is that the business-first analyst uses their operational context to prevent the company from making a disastrous financial decision.
The Problem-Solving Lens: How to Think Like a Revenue-First Analyst
If you want to stop building generic dashboards and start driving business impact, you must adopt a diagnostic framework. When stakeholders come to you with a symptom, your job is to uncover the root cause.
Follow this four-step translation framework:
- Step 1: Identify the Business Symptom: The VP of Sales says, “We missed our Q3 revenue target. Give me a dashboard of all rep activities.”
- Step 2: Pause and Diagnose (The Analyst Mindset): Do not build the dashboard yet. Activity does not equal revenue. You need to find the friction point. Is it top-of-funnel volume? Mid-funnel conversion? Average Order Value (AOV)?
- Step 3: Select the Diagnostic Metrics: You analyze the pipeline and find that Lead Volume was up 10%, but the Proposal-to-Closed-Won conversion rate dropped by 22%.
- Step 4: Deliver the Business Recommendation: You do not just hand over a spreadsheet. You present the finding: “We don’t have an activity problem; we have a pricing or negotiation problem at the bottom of the funnel. Reps are failing to close at the proposal stage. We need to review competitor pricing and our discount approval matrix.”
This is how you build authority. You move from being an order-taker to a strategic advisor.
Real-World Scenario: The Operations Manager Turned Profitability Analyst
Context:
Sarah spent four years managing logistics and vendor relations for a mid-sized e-commerce brand. She decided to transition into data analytics, learned SQL and Power BI, and was hired as an early-stage analyst.
Business Problem:
The company’s overall profit margins were shrinking despite record high gross sales. The executive team assumed shipping costs were the primary issue and asked Sarah to build a dashboard tracking carrier rate hikes.
Analytical Approach:
Because Sarah had operational experience, she knew carrier rates were only part of the story. She didn’t just build the shipping dashboard; she used her analyst language to perform a deep dive into return rates and reverse logistics costs by product category.
Key Metrics / Signals:
She looked beyond Gross Revenue and analyzed Net Revenue after returns. She calculated the Return Processing Cost per Unit.
Insight:
Sarah discovered that while carrier rates had increased by 4%, a specific category of apparel-recently sourced from a new, cheaper manufacturer-had a return rate of 38% due to sizing inconsistencies. The cost of shipping, inspecting, and restocking these specific returns was single-handedly dragging down the company’s net margin.
Business Recommendation:
She presented the data to the executive team, recommending they pause orders from the new manufacturer and liquidate the remaining inventory, proving mathematically that selling the current stock was costing the business more than writing it off.
Outcome:
The company severed the vendor contract, and margins stabilized within two quarters. Sarah wasn’t viewed as a “dashboard builder”-she was recognized as a profitability expert. Her operational past was her greatest analytical asset.
Why Datagen Academy Teaches This Differently
The analytics education market is flooded with generic roadmaps and tool-heavy bootcamps. They teach you how to write a Python loop or how to change the color of a bar chart in Tableau. They assume you are a blank slate.
At Datagen Academy, we know you are not a blank slate.
We focus exclusively on business-first analytics. We do not create mere tool operators; we develop elite analysts who understand business systems.
- We teach diagnosis over syntax: You will learn SQL and BI tools, but you will learn them through the lens of solving real business friction-uncovering conversion bottlenecks, identifying revenue leaks, and mapping the customer journey.
- We connect data to the P&L: We train you to look at every dataset and ask: How does this impact revenue, retention, CAC, LTV, or operational efficiency?
- We elevate your stakeholder communication: You will learn how to push back on bad metric requests, how to frame insights for executives, and how to drive actual business decisions.
If you want to make dashboards look pretty, there are hundreds of cheap tutorials available. If you want to become a strategic partner who impacts the bottom line, you belong at Datagen Academy.
Frequently Asked Questions (FAQ)
- Can I become a data analyst if I only have sales or marketing experience?
Yes. In fact, you have an advantage. The hardest part of analytics is understanding how a business acquires customers, generates revenue, and retains market share. If you have done this practically, you simply need to learn the technical tools (SQL, BI) to quantify what you already know.
- Why is CAC alone misleading when analyzing marketing efficiency?
CAC (Customer Acquisition Cost) only tells you what you paid to get a customer, not what that customer is actually worth. If your CAC is $50 but the customer only spends $40 before churning, you are losing money. This is why CAC must always be analyzed alongside Customer Lifetime Value (CLV) and payback periods.
- I’ve been an analyst for a year, but I feel like I just build reports. How do I change this?
Stop fulfilling requests blindly. When a stakeholder asks for a report, ask them: “What specific business decision will this data influence?” Once you know the decision, you can recommend the right metrics and provide context rather than just a data dump.
- What is the difference between a tool operator and a business-first analyst?
A tool operator focuses on the “how” (How do I write this query? How do I build this chart?). A business-first analyst focuses on the “why” and “so what” (Why is churn spiking? So what if traffic is up if conversions are down?).
- Do I need to be a math genius to do advanced business analytics?
No. Executive-grade business analytics is rarely about complex calculus or advanced machine learning algorithms. It is about logic, structured problem-solving, understanding business models, and basic financial arithmetic (margins, ratios, percentages).
- What are sustainable growth metrics?
These are metrics that prove a business is growing profitably, not just burning cash. Examples include a healthy LTV:CAC ratio (typically 3:1 or higher), low revenue churn, strong net revenue retention (NRR), and a short CAC payback period.
Conclusion
Your business experience is not a past life you must leave behind to become a data analyst; it is the core engine of your future analytical value. Tools like SQL, Python, and Power BI are simply the translation layers you use to convert your operational intuition into executive-grade insights.
Stop viewing yourself as a beginner. Start viewing yourself as a business problem-solver who is acquiring a new, highly leveraged language. When you combine real-world business maturity with technical data skills, you stop being a cost center and become a critical driver of revenue and strategic growth.